系统:centos7.9
elasticsearch-8.5.3
kibana-8.5.3
logstash-8.5.3
filebeat-8.5.3
下载地址:Elastic官网
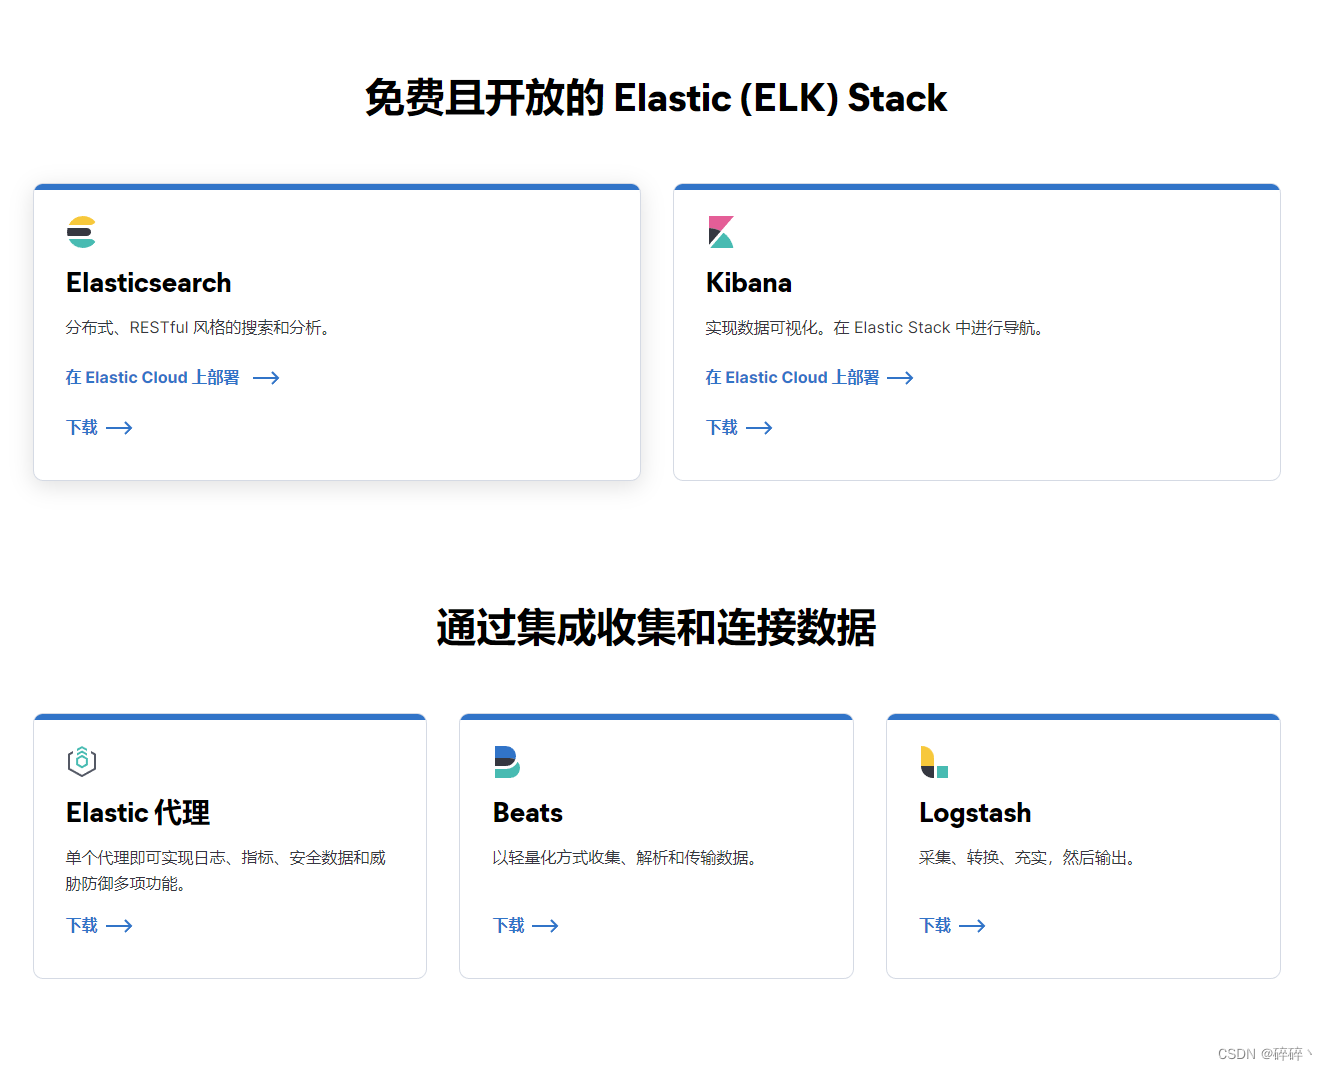
我下载的是rpm格式
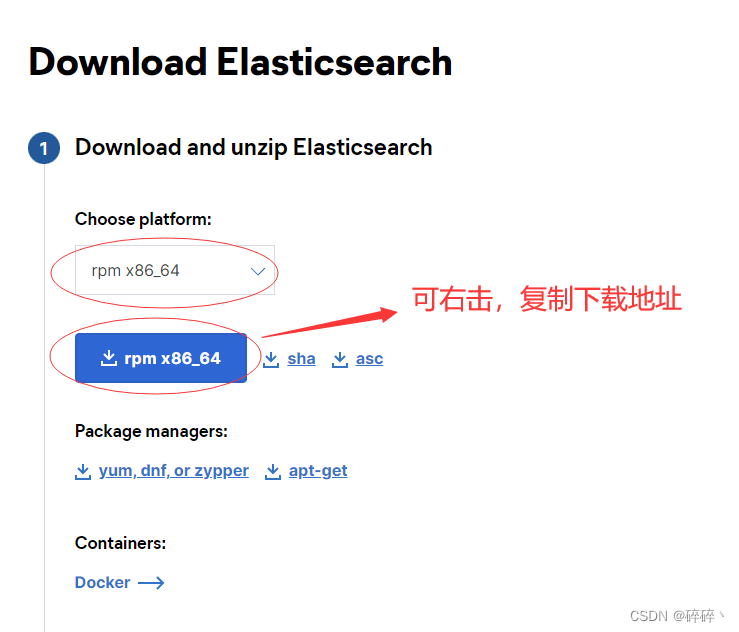
在ssh工具上,可以通过wget 命令将4个rpm包进行下载,
wget https://artifacts.elastic.co/downloads/elasticsearch/elasticsearch-8.5.3-x86_64.rpm
wget https://artifacts.elastic.co/downloads/kibana/kibana-8.5.3-x86_64.rpm
wget https://artifacts.elastic.co/downloads/logstash/logstash-8.5.3-x86_64.rpm
wget https://artifacts.elastic.co/downloads/beats/filebeat/filebeat-8.5.3-x86_64.rpm
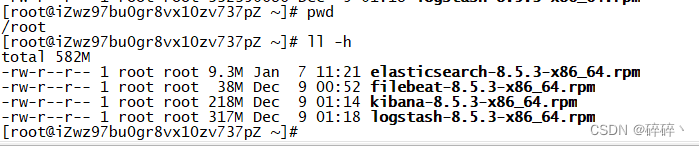
使用yum localinstall 安装本地rpm包,执行代码如下(示例):
yum localinstall elasticsearch-8.5.3-x86_64.rpm
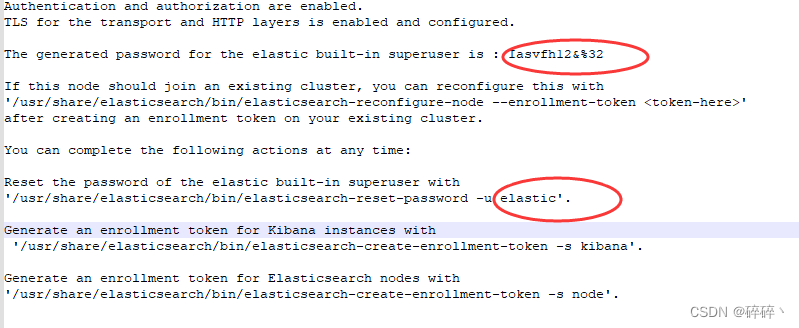
安装完成会生成默认密码,可以记录下,登录kibana时需要
配置elasticsearch.yml文件:
vi /etc/elasticsearch/elasticsearch.yml
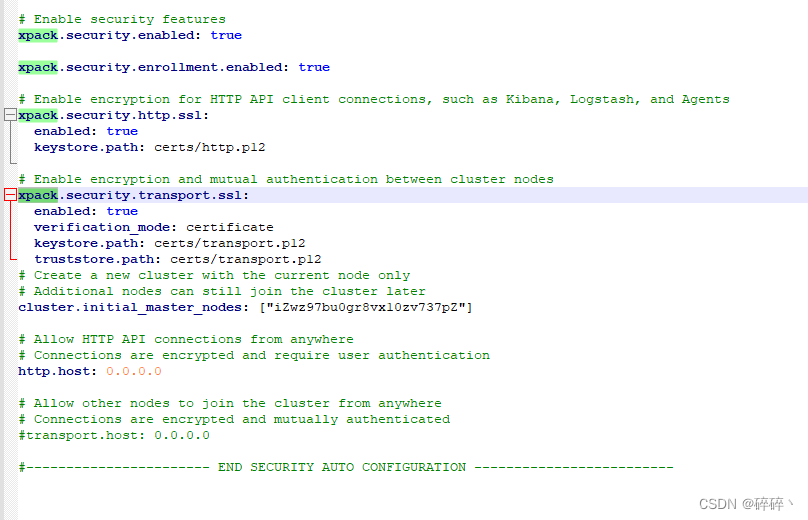
把配置文件中如下几个更改或添加,并打开注释,如下
cluster.name: wxxya-es
http.port: 9200
network.host: 0.0.0.0
http.host: 0.0.0.0
elasticsearch8中多了sslt和安全中心,xpack版块是安装自动生成的不用管
vi /etc/elasticsearch/jvm.options
我这当前设置最大小为3g
-Xms3g
-Xmx3g
启动停止
sudo systemctl start elasticsearch.service
sudo systemctl stop elasticsearch.service
开机自启
sudo /bin/systemctl daemon-reload
sudo /bin/systemctl enable elasticsearch.service
查看elasticsearch启动日志,选其一就行
journalctl --unit elasticsearch
systemctl status elasticsearch.service
例:

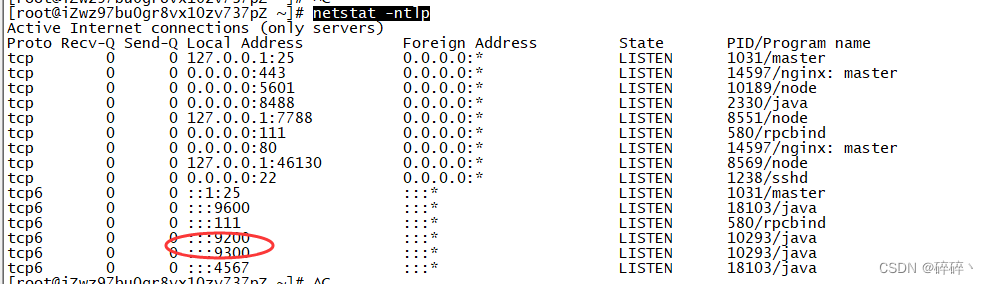
查看端口是否启动,8.x使用curl请求9200,返回:curl: (52) Empty reply from server,必须是https请求。
netstat -ntlp
curl http://localhost:9200
使用yum localinstall 安装本地rpm包,执行代码如下(示例):
yum localinstall kibana-8.5.3-x86_64.rpm
vi /etc/kibana/kibana.yml
把配置文件中kibana改成中文,设置自己本机IP,其它不变。如下
i18n.locale: "zh-CN"
elasticsearch.hosts: ['https://172.24.67.40:9200']

启动停止
sudo systemctl start kibana.service
sudo systemctl stop kibana.service
查看5601商品是否启动

第一次访问改链接的时候需要填入令牌,令牌就是第一次启动elasticsearch时保存的信息中的token,注意这个token只有30分钟的有效期,如果过期了只能进入容器重置token

重置token:进入容器执行
/usr/share/elasticsearch/bin/elasticsearch-create-enrollment-token -s kibana --url "https://127.0.0.1:9200"
输入token以后会看到一个验证码框,验证码从kibana的日志中获取
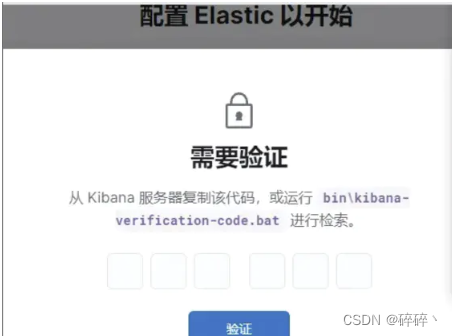
生成验证码
/usr/share/kibana/bin/kibana-verification-code
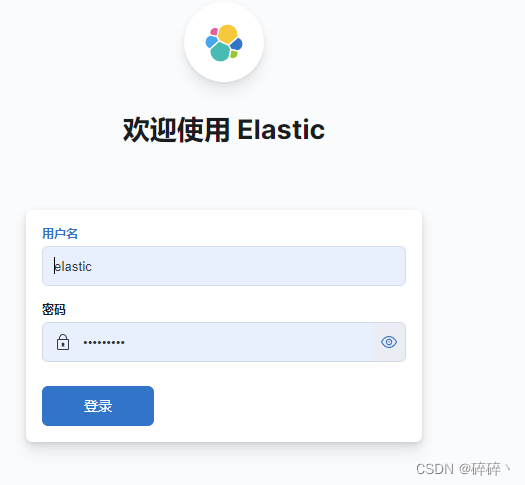
输入用户名:elastic,密码:es安装时记录的密码
使用yum localinstall 安装本地rpm包,执行代码如下(示例):
yum localinstall logstash-8.5.3-x86_64.rpm
vi /etc/logstash/logstash.yml
在kibana.yml文件中增加了
http.host: "0.0.0.0"
http.port: 9600-9700
更改startup.options文件,设置为root用户权限
LS_USER=root
LS_GROUP=root
创建一个logstash.conf配置文件,我这是配置nginx日志和pm2日志,nginx日志格式也得配置一下
vi /etc/logstash/conf.d/logstash.conf
logstash.conf内容如下
# Sample Logstash configuration for creating a simple
# Beats -> Logstash -> Elasticsearch pipeline.

input {

   beats {
    port => 4567
  }
   file {
    path => "/var/log/nginx/access.log"
    type => "nginx-accesslog"
    stat_interval => "1"
    start_position => "beginning"
  }

  file {
    path => "/var/log/nginx/error.log"
    type => "nginx-errorlog"
    stat_interval => "1"
    start_position => "beginning"
  }

}

filter {
  if [type] == "nginx-accesslog" {
  grok {
    match => { "message" => ["%{IPORHOST:clientip} - %{DATA:username} \[%{HTTPDATE:request-time}\] \"%{WORD:request-method} %{DATA:request-uri} HTTP/%{NUMBER:http_version}\" %{NUMBER:response_code} %{NUMBER:body_sent_bytes} \"%{DATA:referrer}\" \"%{DATA:useragent}\""] }
    remove_field => "message"
    add_field => { "project" => "magedu"}
  }
  mutate {
    convert => [ "[response_code]", "integer"]
    }
  }
  if [type] == "nginx-errorlog" {
    grok {
      match => { "message" => ["(?<timestamp>%{YEAR}[./]%{MONTHNUM}[./]%{MONTHDAY} %{TIME}) \[%{LOGLEVEL:loglevel}\] %{POSINT:pid}#%{NUMBER:threadid}\: \*%{NUMBER:connectionid} %{GREEDYDATA:message}, client: %{IPV4:clientip}, server: %{GREEDYDATA:server}, request: \"(?:%{WORD:request-method} %{NOTSPACE:request-uri}(?: HTTP/%{NUMBER:httpversion}))\", host: %{GREEDYDATA:domainname}"]}
      remove_field => "message"
    }
  }
}

output {
	if [type] == "nginx-accesslog" {
    elasticsearch {
		hosts => ["https://172.24.67.40:9200"]
		index => "nginx-accesslog-%{+yyyy.MM.dd}"
		ssl => true
		ssl_certificate_verification => false
		user => "elastic"
		password => "tsy123456"
	}}
	if [type] == "nginx-errorlog" {
    elasticsearch {
		hosts => ["https://172.24.67.40:9200"]
		index => "nginx-errorlog-%{+yyyy.MM.dd}"
		ssl => true
		ssl_certificate_verification => false
		user => "elastic"
		password => "tsy123456"
	}}
	if [fields][service] == "pm2" {
    elasticsearch {
		hosts => ["https://172.24.67.40:9200"]
		index => "pm2-log-%{+yyyy.MM.dd}"
		ssl => true
		ssl_certificate_verification => false
		user => "elastic"
		password => "tsy123456"
	}}
}
我之前出过nginx配置和安装:nginx安装教程
vi /etc/nginx/nginx.conf
nginx文件更改内容,设置json日志格式
user root;
worker_processes auto;

pid /run/nginx.pid;


events {
    worker_connections 1024;
}

http {
    log_format  main  '$remote_addr - $remote_user [$time_local] "$request" '
                      '$status $body_bytes_sent "$http_referer" '
                      '"$http_user_agent" "$http_x_forwarded_for"';

	log_format json '{ "@timestamp": "$time_iso8601", '
                     '"remote_addr": "$remote_addr", ' # 客户端的ip地址
                     '"remote_user": "$remote_user", '  # 客户端用户名称
                     '"body_bytes_sent": "$body_bytes_sent", ' # 发送给客户端文件主体内容大小
                     '"request_time": "$request_time", '
                     '"status": "$status", '
                     '"host": "$host", '
                     '"request": "$request", ' # 请求的url与http协议
                     '"request_method": "$request_method", '
                     '"uri": "$uri", '
                     '"http_referrer": "$http_referer", ' # 从那个页面链接访问过来的
                     '"http_x_forwarded_for": "$http_x_forwarded_for", ' # 客户端真实ip地址

                     '"http_user_agent": "$http_user_agent" '  # 客户端浏览器的相关信息

                '}';

    access_log  /var/log/nginx/access.log  json ;
	error_log /var/log/nginx/error.log;


	#autoindex on;   #开启nginx目录浏览功能
    #autoindex_exact_size off;   #文件大小从KB开始显示
    #autoindex_localtime on;   #显示文件修改时间为服务器本地时间
	#charset utf-8,gbk;	#中文目录的话会出现乱码问题,加上

    sendfile            on;
    tcp_nopush          on;
    tcp_nodelay         on;
    keepalive_timeout   65;
    types_hash_max_size 2048;
    server_names_hash_bucket_size 128;
    client_header_buffer_size 32k;
    large_client_header_buffers 4 32k;
    client_max_body_size 500m;
    client_body_buffer_size 512k;

   # 代理的相关参数设置
    proxy_connect_timeout 5;
    proxy_read_timeout 60;
    proxy_send_timeout 5;
    proxy_buffer_size 16k;
    proxy_buffers 4 64k;
    proxy_busy_buffers_size 128k;
    proxy_temp_file_write_size 128k;


   # 启用gzip压缩,提高用户访问速度
    gzip on;
    gzip_min_length 1k;
    gzip_buffers 4 16k;
    gzip_http_version 1.1;
    gzip_comp_level 2;
    gzip_types text/plain application/css application/javascript application/x-javascript text/css application/xml text/javascript application/x-httpd-php image/jpeg image/gif image/png;
    gzip_vary on;

    include             /etc/nginx/mime.types;
    default_type        application/octet-stream;


    include /etc/nginx/conf.d/*.conf;
}
启动停止
sudo systemctl start logstash.service
sudo systemctl stop logstash.service
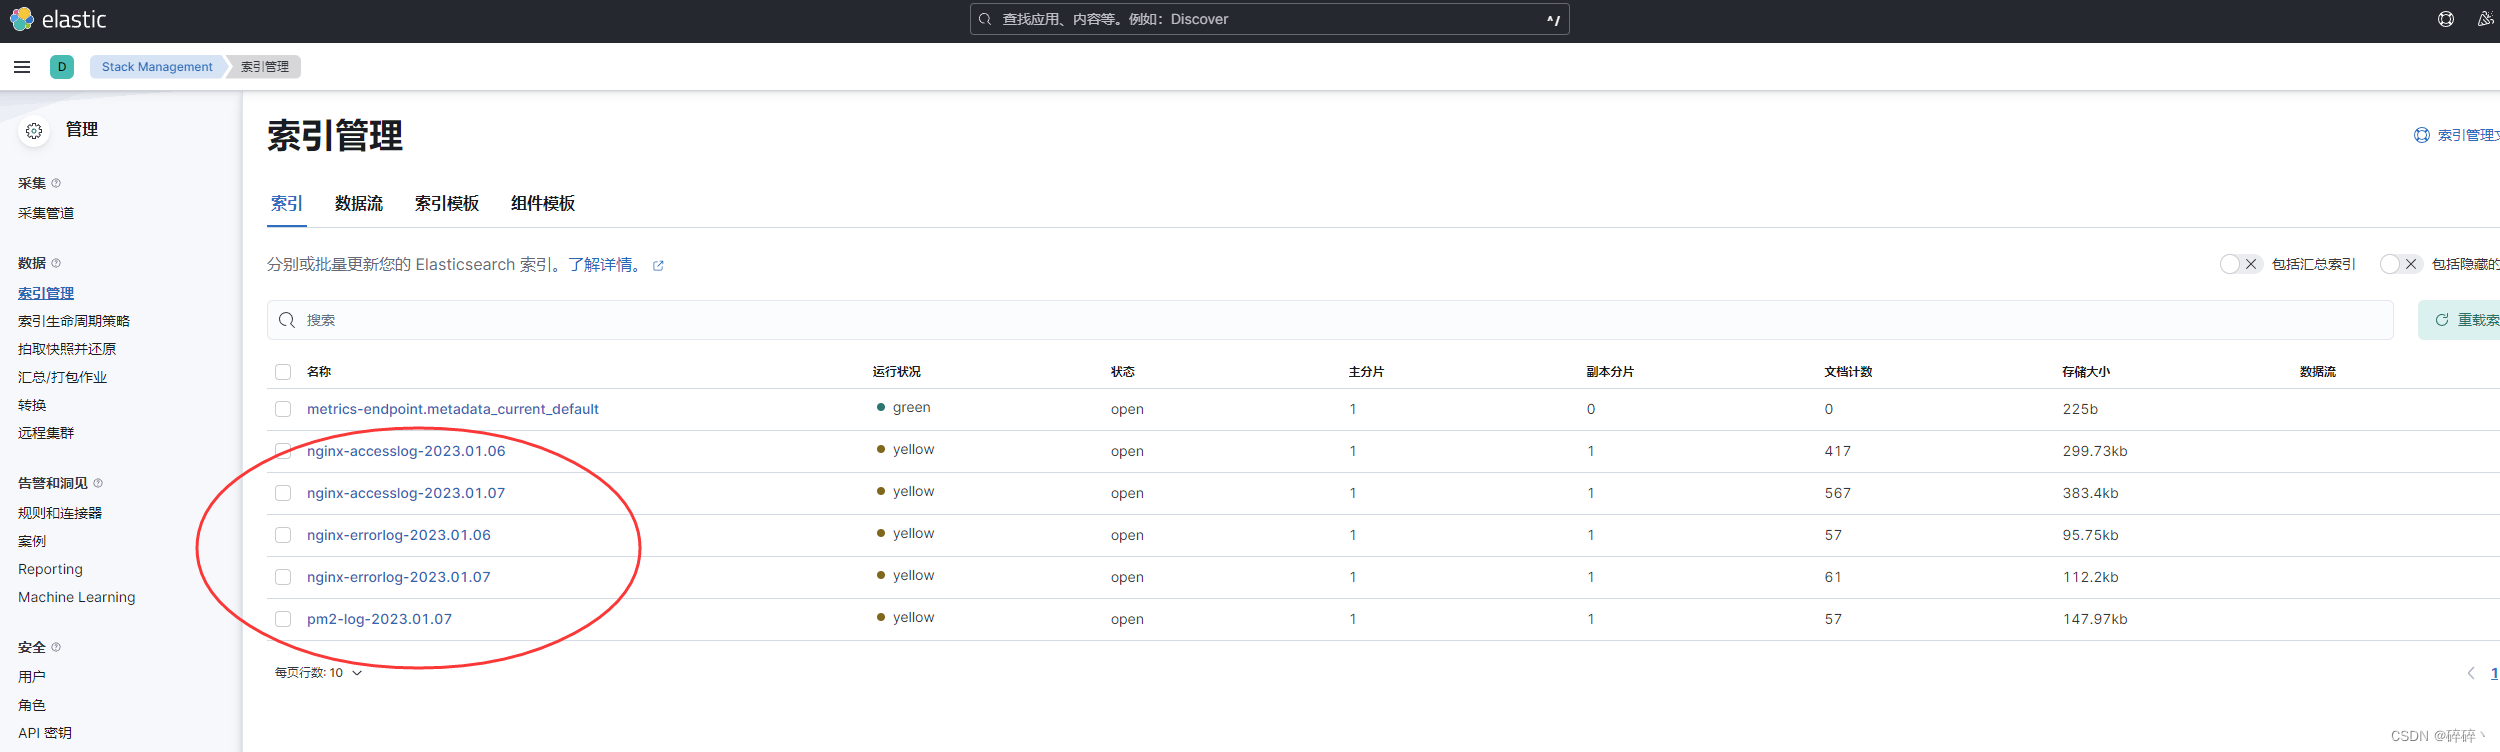
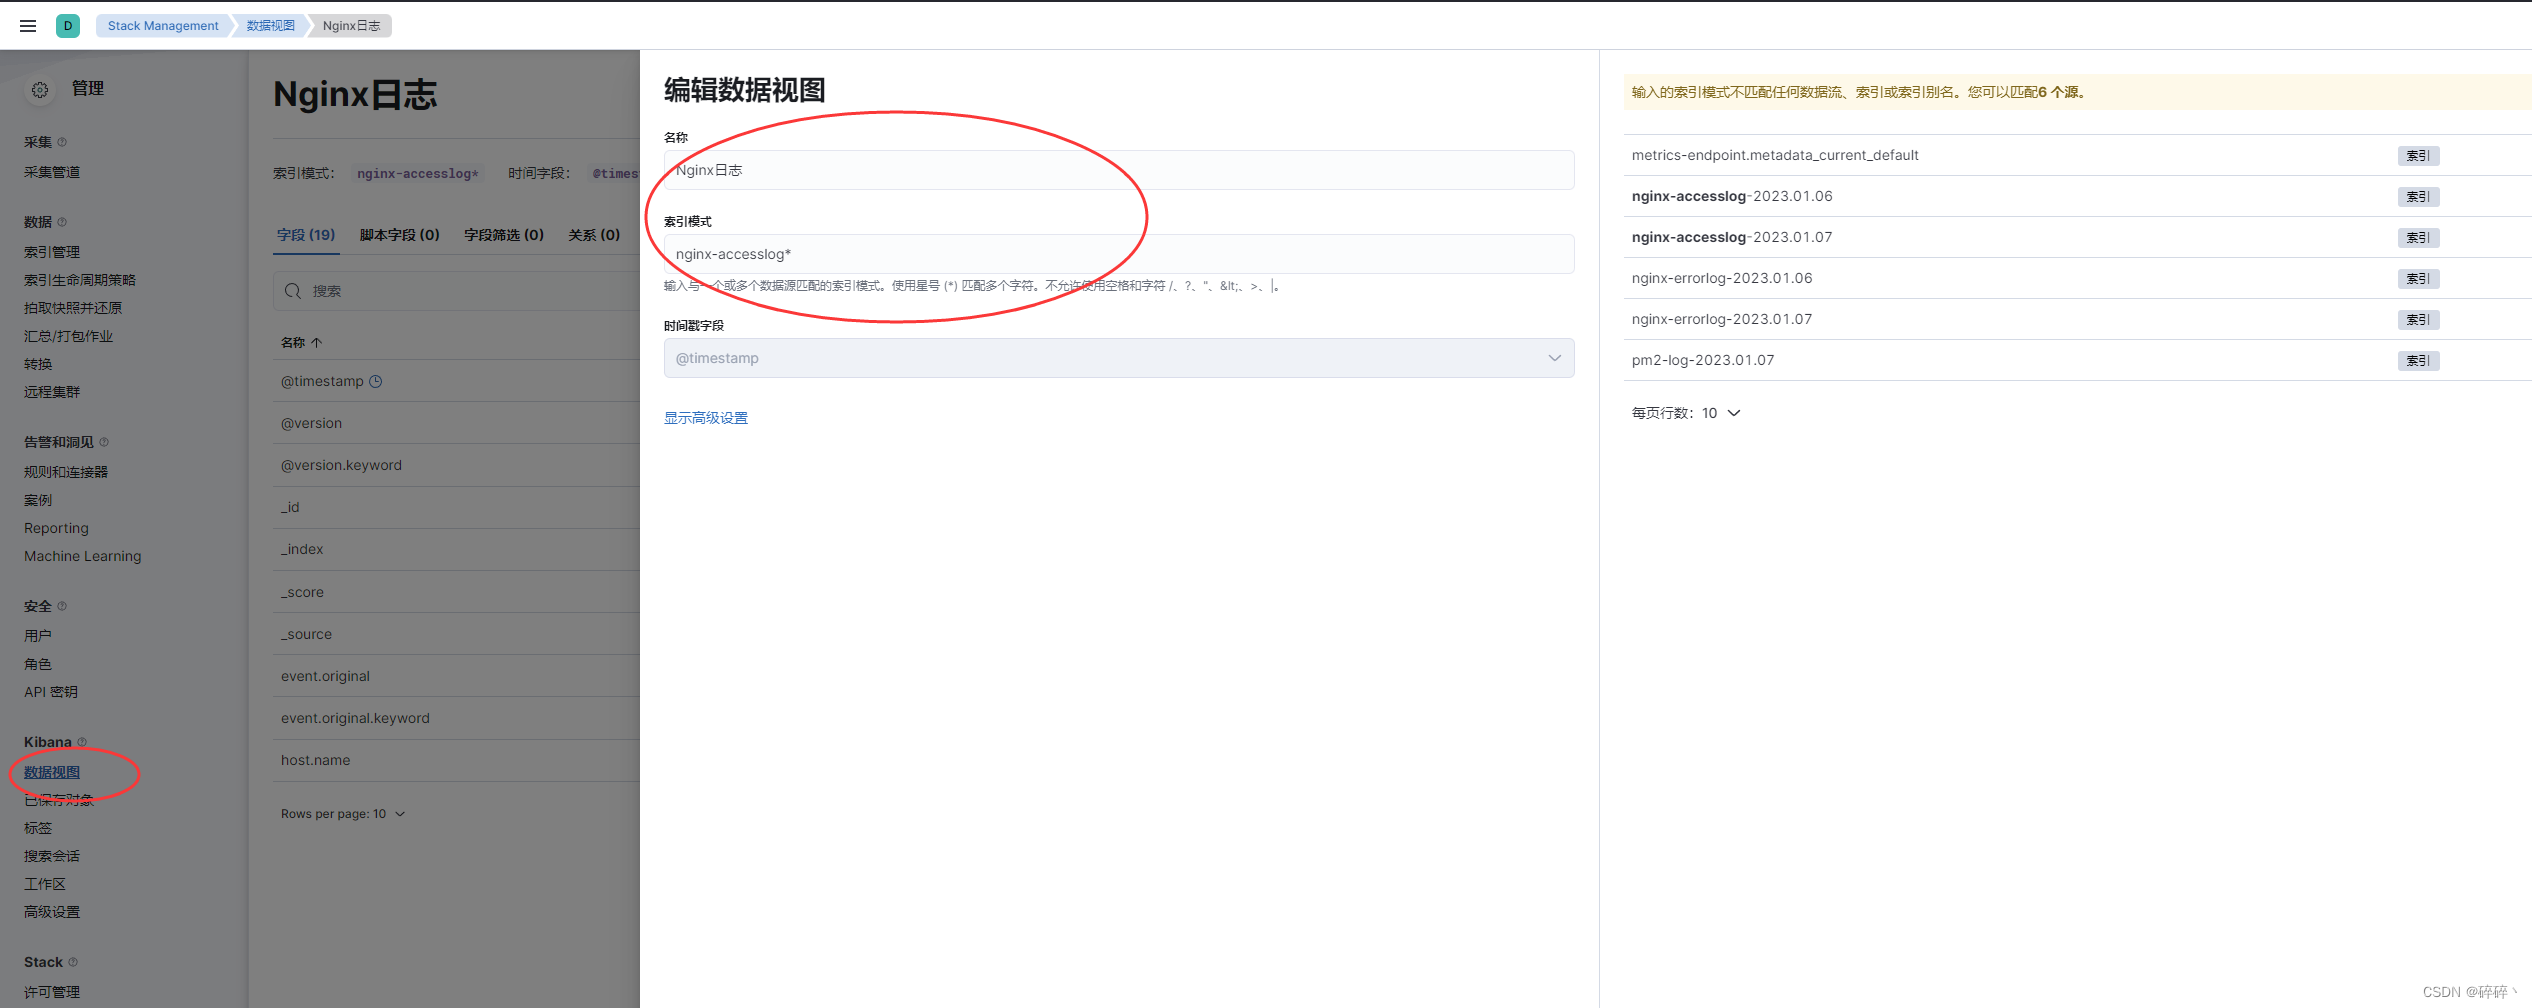
创建数据视图与索引关联
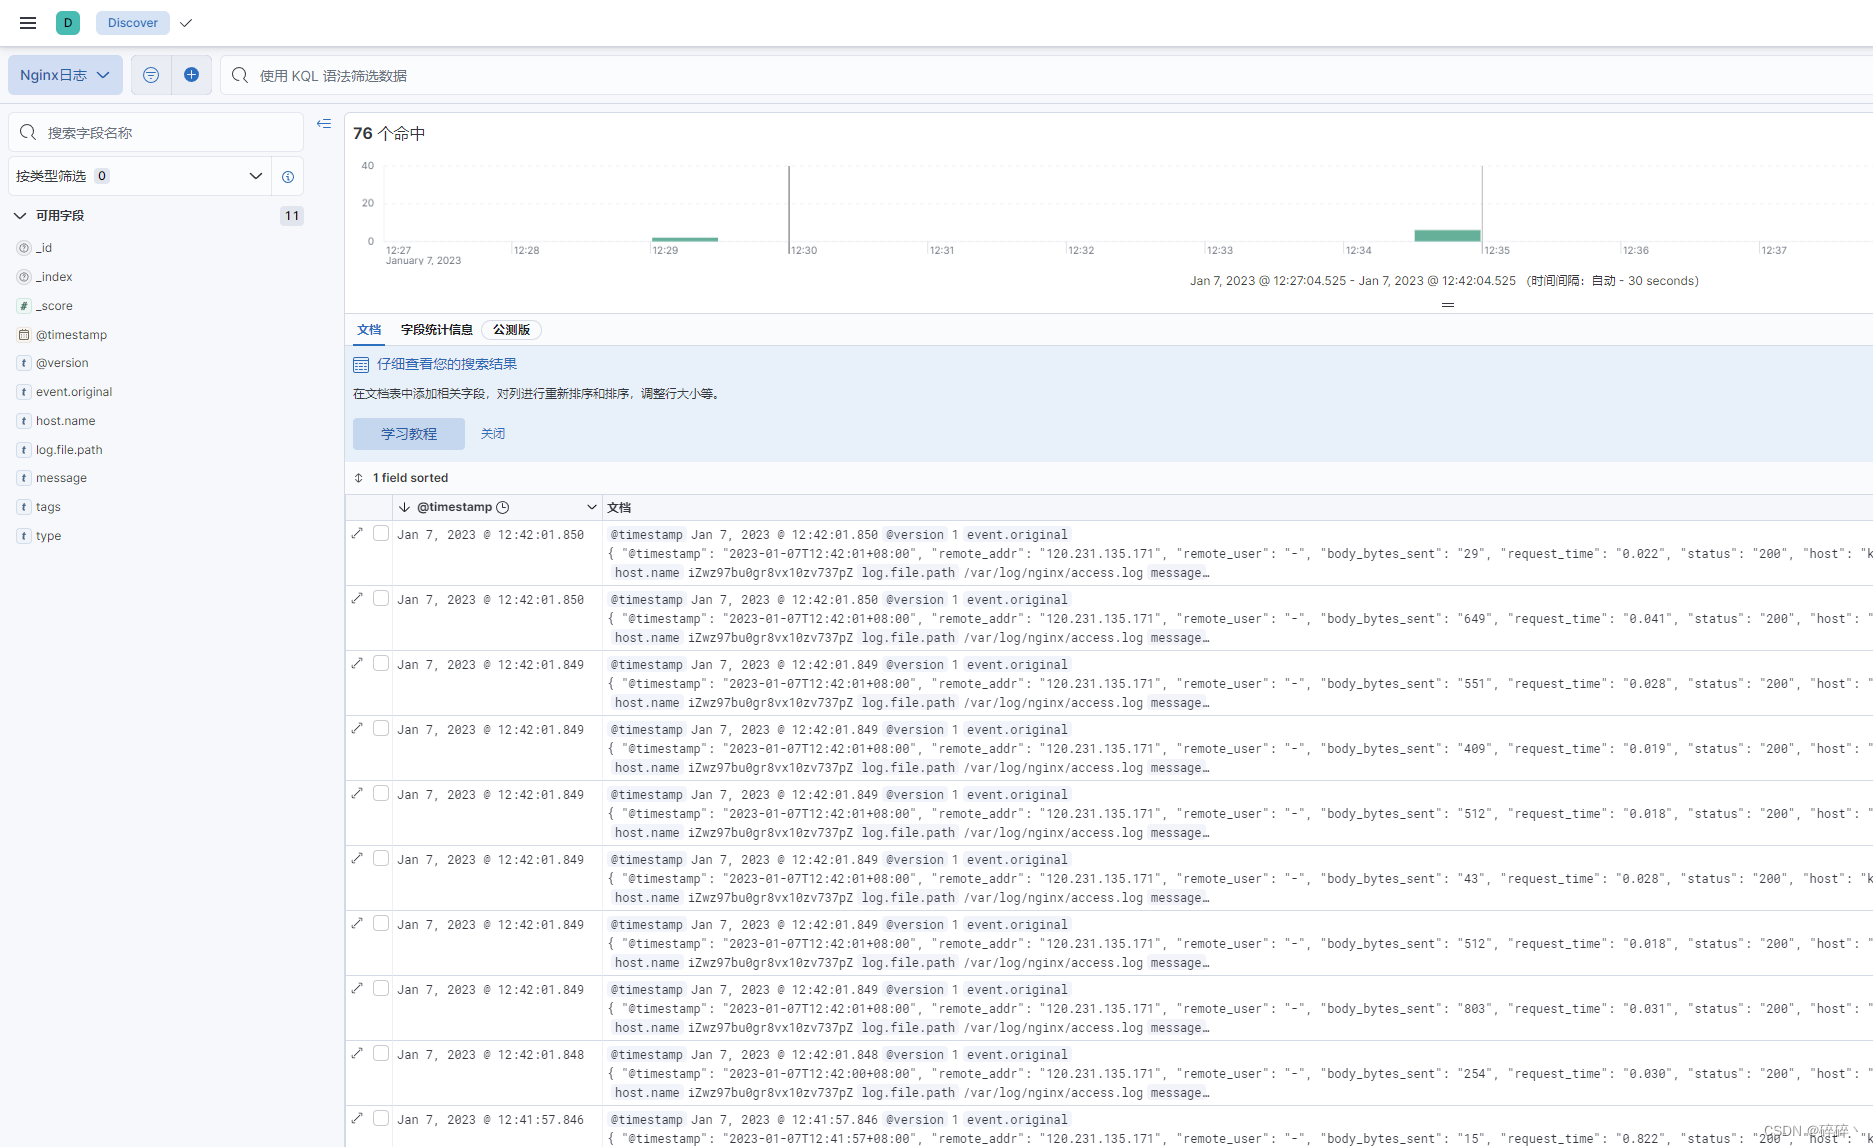
数据展示
使用yum localinstall 安装本地rpm包,执行代码如下(示例):
yum localinstall filebeat-8.5.3-x86_64.rpm
vi /etc/filebeat/filebeat.yml
在filebeat.yml文件中主要配置读取paths设置,和对接到logstash中,filebeat我配置的是读pm2日志,整体配置文件内容如下
###################### Filebeat Configuration Example #########################

# This file is an example configuration file highlighting only the most common
# options. The filebeat.reference.yml file from the same directory contains all the
# supported options with more comments. You can use it as a reference.
#
# You can find the full configuration reference here:
# https://www.elastic.co/guide/en/beats/filebeat/index.html

# For more available modules and options, please see the filebeat.reference.yml sample
# configuration file.

# ============================== Filebeat inputs ===============================

filebeat.inputs:

# Each - is an input. Most options can be set at the input level, so
# you can use different inputs for various configurations.
# Below are the input specific configurations.

# filestream is an input for collecting log messages from files.
- type: filestream

  # Unique ID among all inputs, an ID is required.
  id: my-filestream-id

  # Change to true to enable this input configuration.
  enabled: true

  # Paths that should be crawled and fetched. Glob based paths.
  paths:
    - /root/.pm2/logs/*.log
  input_type: log
  fields.document_type: pm2
  fields.service: pm2
  tags: ["pm2"]

    #- c:\programdata\elasticsearch\logs\*

  # Exclude lines. A list of regular expressions to match. It drops the lines that are
  # matching any regular expression from the list.
  # Line filtering happens after the parsers pipeline. If you would like to filter lines
  # before parsers, use include_message parser.
  #exclude_lines: ['^DBG']

  # Include lines. A list of regular expressions to match. It exports the lines that are
  # matching any regular expression from the list.
  # Line filtering happens after the parsers pipeline. If you would like to filter lines
  # before parsers, use include_message parser.
  #include_lines: ['^ERR', '^WARN']

  # Exclude files. A list of regular expressions to match. Filebeat drops the files that
  # are matching any regular expression from the list. By default, no files are dropped.
  #prospector.scanner.exclude_files: ['.gz$']

  # Optional additional fields. These fields can be freely picked
  # to add additional information to the crawled log files for filtering
  #fields:
  #  level: debug
  #  review: 1

# ============================== Filebeat modules ==============================

filebeat.config.modules:
  # Glob pattern for configuration loading
  path: ${path.config}/modules.d/*.yml

  # Set to true to enable config reloading
  reload.enabled: false

  # Period on which files under path should be checked for changes
  #reload.period: 10s

# ======================= Elasticsearch template setting =======================

setup.template.settings:
  index.number_of_shards: 1
  #index.codec: best_compression
  #_source.enabled: false


# ================================== General ===================================

# The name of the shipper that publishes the network data. It can be used to group
# all the transactions sent by a single shipper in the web interface.
#name:

# The tags of the shipper are included in their own field with each
# transaction published.
#tags: ["service-X", "web-tier"]

# Optional fields that you can specify to add additional information to the
# output.
#fields:
#  env: staging

# ================================= Dashboards =================================
# These settings control loading the sample dashboards to the Kibana index. Loading
# the dashboards is disabled by default and can be enabled either by setting the
# options here or by using the `setup` command.
#setup.dashboards.enabled: false

# The URL from where to download the dashboards archive. By default this URL
# has a value which is computed based on the Beat name and version. For released
# versions, this URL points to the dashboard archive on the artifacts.elastic.co
# website.
#setup.dashboards.url:

# =================================== Kibana ===================================

# Starting with Beats version 6.0.0, the dashboards are loaded via the Kibana API.
# This requires a Kibana endpoint configuration.
setup.kibana:
  host: "localhost:5601"
  # Kibana Host
  # Scheme and port can be left out and will be set to the default (http and 5601)
  # In case you specify and additional path, the scheme is required: http://localhost:5601/path
  # IPv6 addresses should always be defined as: https://[2001:db8::1]:5601
  #host: "localhost:5601"

  # Kibana Space ID
  # ID of the Kibana Space into which the dashboards should be loaded. By default,
  # the Default Space will be used.
  #space.id:

# =============================== Elastic Cloud ================================

# These settings simplify using Filebeat with the Elastic Cloud (https://cloud.elastic.co/).

# The cloud.id setting overwrites the `output.elasticsearch.hosts` and
# `setup.kibana.host` options.
# You can find the `cloud.id` in the Elastic Cloud web UI.
#cloud.id:

# The cloud.auth setting overwrites the `output.elasticsearch.username` and
# `output.elasticsearch.password` settings. The format is `<user>:<pass>`.
#cloud.auth:

# ================================== Outputs ===================================

# Configure what output to use when sending the data collected by the beat.

# ---------------------------- Elasticsearch Output ----------------------------
#output.elasticsearch:
  # Array of hosts to connect to.
#  hosts: ["localhost:9200"]

  # Protocol - either `http` (default) or `https`.
  #protocol: "https"

  # Authentication credentials - either API key or username/password.
  #api_key: "id:api_key"
  #username: "elastic"
  #password: "changeme"

# ------------------------------ Logstash Output -------------------------------
output.logstash:
  # The Logstash hosts
  hosts: ["localhost:4567"]

  # Optional SSL. By default is off.
  # List of root certificates for HTTPS server verifications
  #ssl.certificate_authorities: ["/etc/pki/root/ca.pem"]

  # Certificate for SSL client authentication
  #ssl.certificate: "/etc/pki/client/cert.pem"

  # Client Certificate Key
  #ssl.key: "/etc/pki/client/cert.key"

# ================================= Processors =================================
processors:
  - add_host_metadata:
      when.not.contains.tags: forwarded
  - add_cloud_metadata: ~
  - add_docker_metadata: ~
  - add_kubernetes_metadata: ~
启动停止
sudo systemctl start filebeat.service
sudo systemctl stop filebeat.service
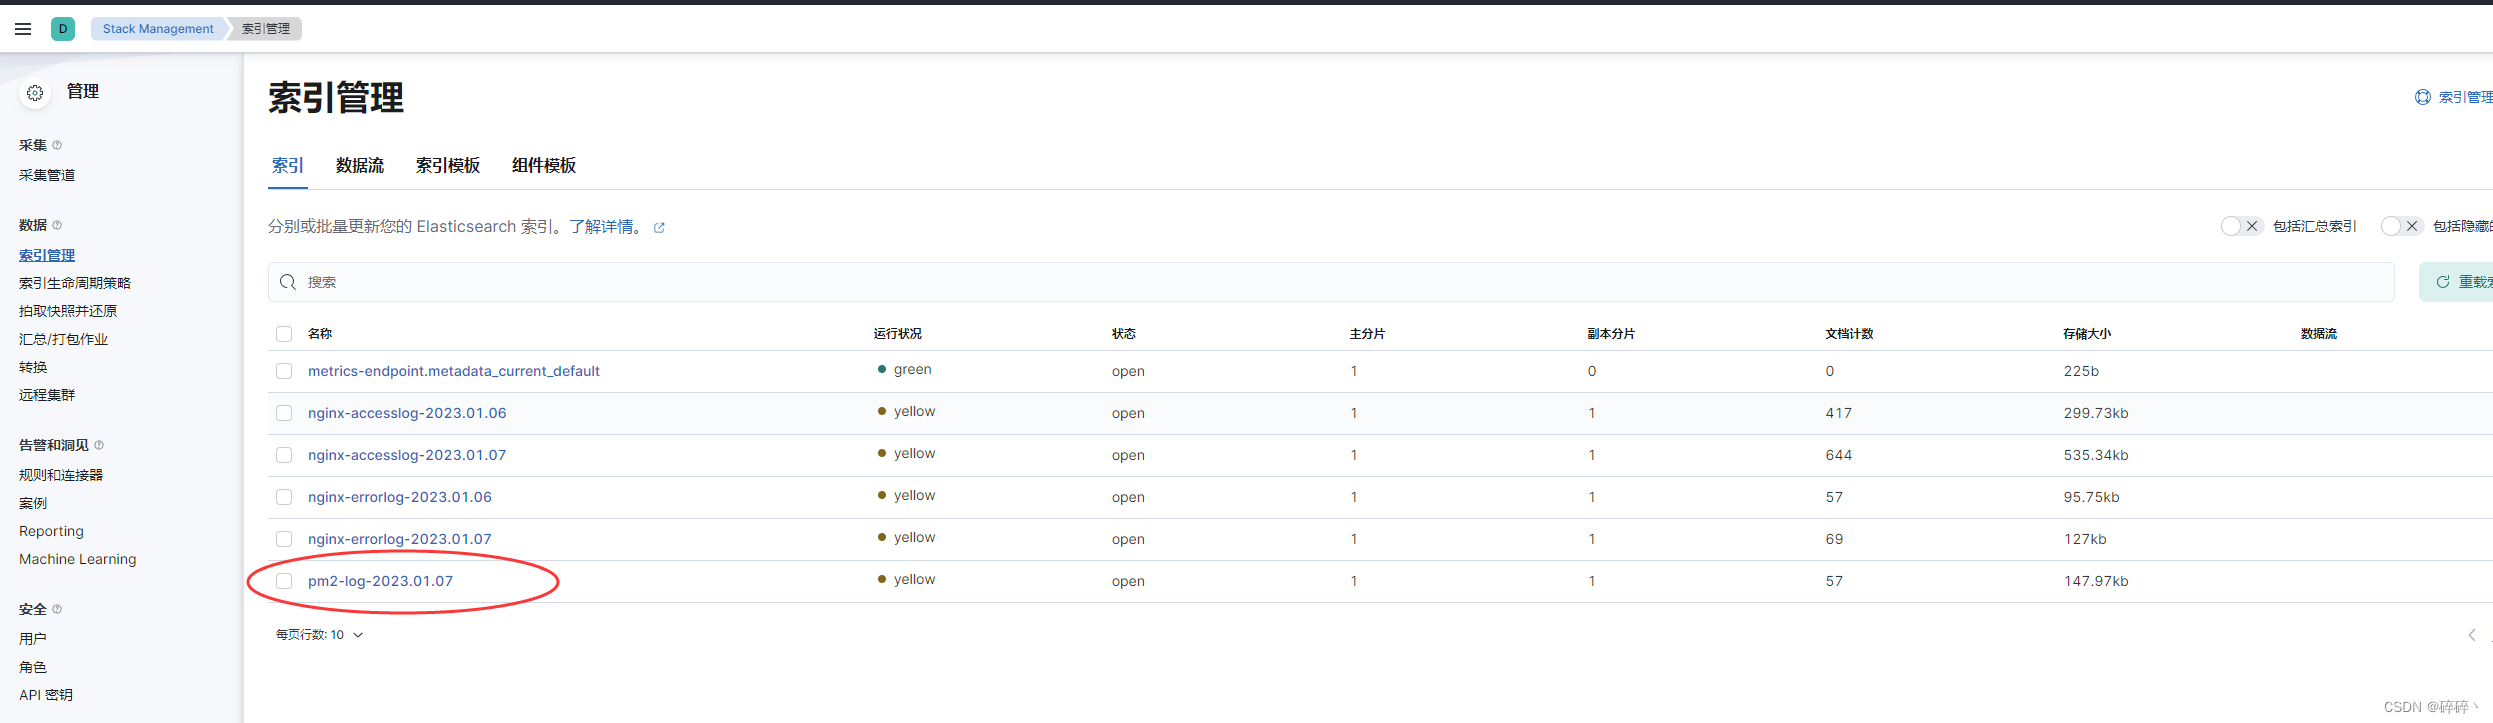
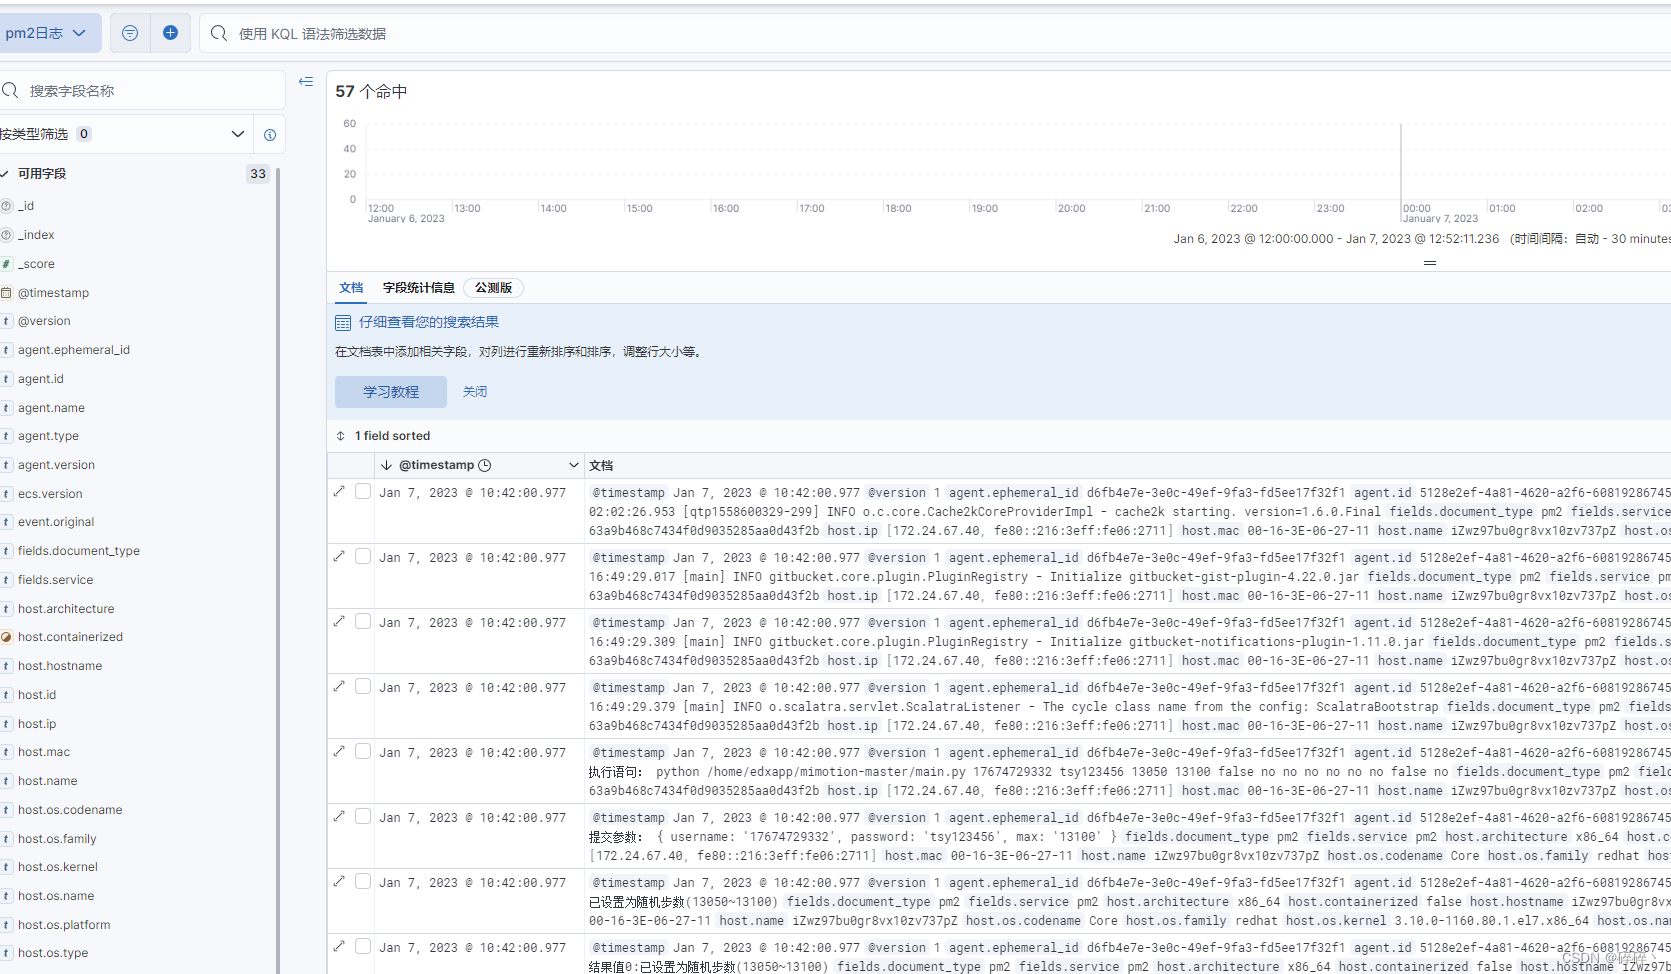
以上就是今天要讲的内容,详细的介绍了ELK8全家桶安装细节,有问题的请评论区留言。
我想为Heroku构建一个Rails3应用程序。他们使用Postgres作为他们的数据库,所以我通过MacPorts安装了postgres9.0。现在我需要一个postgresgem并且共识是出于性能原因你想要pggem。但是我对我得到的错误感到非常困惑当我尝试在rvm下通过geminstall安装pg时。我已经非常明确地指定了所有postgres目录的位置可以找到但仍然无法完成安装:$envARCHFLAGS='-archx86_64'geminstallpg--\--with-pg-config=/opt/local/var/db/postgresql90/defaultdb/po
我打算为ruby脚本创建一个安装程序,但我希望能够确保机器安装了RVM。有没有一种方法可以完全离线安装RVM并且不引人注目(通过不引人注目,就像创建一个可以做所有事情的脚本而不是要求用户向他们的bash_profile或bashrc添加一些东西)我不是要脚本本身,只是一个关于如何走这条路的快速指针(如果可能的话)。我们还研究了这个很有帮助的问题:RVM-isthereawayforsimpleofflineinstall?但有点误导,因为答案只向我们展示了如何离线在RVM中安装ruby。我们需要能够离线安装RVM本身,并查看脚本https://raw.github.com/wayn
我有一个奇怪的问题:我在rvm上安装了rubyonrails。一切正常,我可以创建项目。但是在我输入“railsnew”时重新启动后,我有“程序'rails'当前未安装。”。SystemUbuntu12.04ruby-v"1.9.3p194"gemlistactionmailer(3.2.5)actionpack(3.2.5)activemodel(3.2.5)activerecord(3.2.5)activeresource(3.2.5)activesupport(3.2.5)arel(3.0.2)builder(3.0.0)bundler(1.1.4)coffee-rails(
我刚刚为fedora安装了emacs。我想用emacs编写ruby。为ruby提供代码提示、代码完成类型功能所需的工具、扩展是什么? 最佳答案 ruby-mode已经包含在Emacs23之后的版本中。不过,它也可以通过ELPA获得。您可能感兴趣的其他一些事情是集成RVM、feature-mode(Cucumber)、rspec-mode、ruby-electric、inf-ruby、rinari(用于Rails)等。这是我当前用于Ruby开发的Emacs配置:https://github.com/citizen428/emacs
我正在尝试在我的centos服务器上安装therubyracer,但遇到了麻烦。$geminstalltherubyracerBuildingnativeextensions.Thiscouldtakeawhile...ERROR:Errorinstallingtherubyracer:ERROR:Failedtobuildgemnativeextension./usr/local/rvm/rubies/ruby-1.9.3-p125/bin/rubyextconf.rbcheckingformain()in-lpthread...yescheckingforv8.h...no***e
我的最终目标是安装当前版本的RubyonRails。我在OSXMountainLion上运行。到目前为止,这是我的过程:已安装的RVM$\curl-Lhttps://get.rvm.io|bash-sstable检查已知(我假设已批准)安装$rvmlistknown我看到当前的稳定版本可用[ruby-]2.0.0[-p247]输入命令安装$rvminstall2.0.0-p247注意:我也试过这些安装命令$rvminstallruby-2.0.0-p247$rvminstallruby=2.0.0-p247我很快就无处可去了。结果:$rvminstall2.0.0-p247Search
我实际上是在尝试使用RVM在我的OSX10.7.5上更新ruby,并在输入以下命令后:rvminstallruby我得到了以下回复:Searchingforbinaryrubies,thismighttakesometime.Checkingrequirementsforosx.Installingrequirementsforosx.Updatingsystem.......Errorrunning'requirements_osx_brew_update_systemruby-2.0.0-p247',pleaseread/Users/username/.rvm/log/138121
由于fast-stemmer的问题,我很难安装我想要的任何rubygem。我把我得到的错误放在下面。Buildingnativeextensions.Thiscouldtakeawhile...ERROR:Errorinstallingfast-stemmer:ERROR:Failedtobuildgemnativeextension./System/Library/Frameworks/Ruby.framework/Versions/2.0/usr/bin/rubyextconf.rbcreatingMakefilemake"DESTDIR="cleanmake"DESTDIR=
当我尝试安装Ruby时遇到此错误。我试过查看this和this但无济于事➜~brewinstallrubyWarning:YouareusingOSX10.12.Wedonotprovidesupportforthispre-releaseversion.Youmayencounterbuildfailuresorotherbreakages.Pleasecreatepull-requestsinsteadoffilingissues.==>Installingdependenciesforruby:readline,libyaml,makedepend==>Installingrub
当我执行>rvminstall1.9.2时一切顺利。然后我做>rvmuse1.9.2也很顺利。但是当涉及到ruby-v时..sam@sjones:~$rvminstall1.9.2/home/sam/.rvm/rubies/ruby-1.9.2-p136,thismaytakeawhiledependingonyourcpu(s)...ruby-1.9.2-p136-#fetchingruby-1.9.2-p136-#downloadingruby-1.9.2-p136,thismaytakeawhiledependingonyourconnection...%Total%Rece