在做GIS相关的工作过程中,是离不开矢量的数据的。矢量作为最基础的数据形式,一般通用在各个项目中。在导航软件开发或者应用中,点/线/面的标记,标绘,显示等都是不可缺少的。本文主要是来介绍在地图上基于OpenLayers实现点/线/面静态的绘制显示方法。
本文的实现是在前文的框架基础上,继续添加点线面样式和显示函数。具体的准备内容包括ol库文件,瓦片地图服务等。参考:基于OpenLayers实现导航地图上(起/终)点的交互式图标显示的准备内容,和地图瓦片数据的多种利用形式以及瓦片数据的浏览显示的地图创建与后端服务启动。
在地图上增加点/线/面,则需要在地图之上增加一个矢量图层。
    //创建矢量图层
    var vecSource = new ol.source.Vector();
    var vecLayer = new ol.layer.Vector({
        source: vecSource
    });
    vecSource.clear();
    map.addLayer(vecLayer);//添加到map里面
注意:如果点线面公用一个图层,如果项目中有清除的功能,那么会使所有已存在的矢量均被清除。为此,根据项目需要,可创建多个矢量图层分别去控制point、line、polygon的要素,即可分别作用显示和清除。
样式的处理一般有两种方式:1、固定写法,放在之前,用时直接调用;2、不固定写法,在绘制的时候再写,可处理细节。
//点样式
    var pointStyle = new ol.style.Style({
    	image:new ol.style.Circle({
			radius:5,//半径
			fill:new ol.style.Fill({
				color:'red'
			}),	//填充颜色
			stroke: new ol.style.Stroke({
				color: 'green',
				width: 1
			})//外环颜色和粗细
		})
    })

    //线样式
    var lineStyle = new ol.style.Style({
        stroke: new ol.style.Stroke({
            color: 'blue',
            width: 3
        })
    })
    //面样式
    var polygonStyle = new ol.style.Style({
		text:new ol.style.Text({
        	testAlign:'center',
        	text:"区域",
       		font:'bold 20px 微软雅黑',
        	fill:new ol.style.Fill({
            	color:'#19339e'
  			})
    	}),
    	fill: new ol.style.Fill({
    		color: '#0055ff'
			}),
		stroke: new ol.style.Stroke({
			color: '#ffcc33',
			width: 3
		})
	})
上面写的例子可以看出,写死后,直接调用,样式基本就固定了。细微细节想要变化不太好处理了。
直接在对点线面绘制遍历过程逐一添加样式,可以增加细节上的优化。
            //点样式
            var pointStyle = new ol.style.Style({
	    		text:new ol.style.Text({
					testAlign:'left',
					text:i+"     ",             ///可变化
					font:'bold 15px 微软雅黑',
					fill:new ol.style.Fill({
						color:'yellow'
					})
				}),
    			image:new ol.style.Circle({
					radius:r,//半径
					fill:new ol.style.Fill({
						color:c1
					}),	//填充颜色
					stroke: new ol.style.Stroke({
						color: c2,
						width: w
					})//渐变颜色和大小
				})
    		});
点样式放在每个点要素的绘制过程中,可以对每个点要素进行标注等等,而固定写法则没法做到序号标注。
            var pFeature = new ol.Feature(geoPoint);
            //pFeature.setStyle(pointStyle);
            pFeature.setStyle(new ol.style.Style({
                 text:new ol.style.Text({
                     testAlign:'left',
                     text:i+"    ",
                     font:'bold 20px 微软雅黑',
                     fill:new ol.style.Fill({
                         color:'red'
                     })
                 }),
            }));
线样式中则可以对每个节点进行标注,处理显示。
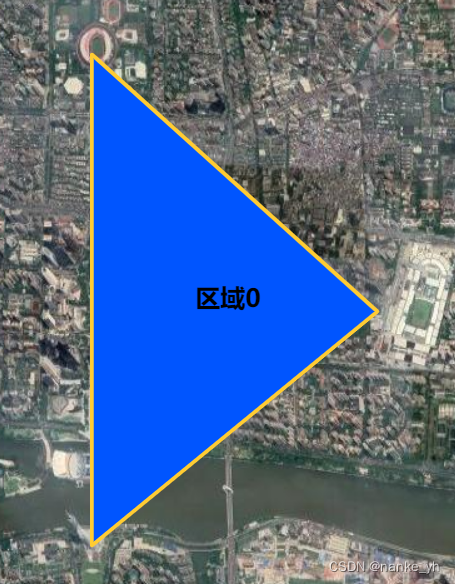
            var polygonStyle = new ol.style.Style({
				text:new ol.style.Text({
                	testAlign:'center',
                	text:"区域"+i,
               		font:'bold 20px 微软雅黑',
                	fill:new ol.style.Fill({
                    	color:'black'
		  			})
		    	}),
		    	fill: new ol.style.Fill({
            		color: '#0055ff'
       			}),
				stroke: new ol.style.Stroke({
					color: '#ffcc33',
					width: 3
				})
			});
面样式放在每个面要素的绘制过程中进行渲染,可以获得想要的标注等样式。
为显示效果模拟的数据:
var vectorlist = {"point":[[113.76101 , 23.52712],[113.73627 , 23.51769],[113.76506 , 23.51675],[113.74415 , 23.49535],[113.74415 , 23.49995],[113.75082 , 23.49976],[113.319 , 23.140],[113.319 , 23.109],[113.3386 , 23.1238]],"line":[[113.3386 , 23.1238],[113.4506 , 23.2675],[113.5415 , 23.49535],[113.74415 , 23.49995]],"polygon":["[[113.319 , 23.140],[113.319 , 23.109],[113.3386 , 23.1238]]","[[113.76101 , 23.52712],[113.73627 , 23.51769],[113.74415 , 23.49995],[113.76506 , 23.51675]]"]}代码:
    function drawPoint(PointList){

        vecSource.clear();

        var points = PointList.point;//使用过程中需要修改为被请求服务中的字段

        for(var i=0;i<points.length;i++){

            var point = new ol.geom.Point(ol.proj.fromLonLat(points[i]));
	    	var feature = new ol.Feature(point);
	    	var pointStyle = new ol.style.Style({
	    		text:new ol.style.Text({
					testAlign:'left',
					text:i+"     ",
					font:'bold 15px 微软雅黑',
					fill:new ol.style.Fill({
						color:'yellow'
					})
				}),
    			image:new ol.style.Circle({
					radius:5,//半径
					fill:new ol.style.Fill({
						color:'red'
					}),	//填充颜色
					stroke: new ol.style.Stroke({
						color: 'blue',
						width: 1
					})//渐变颜色和大小
				})
    		});
	    	feature.setStyle(pointStyle);
	    	vecSource.addFeature(feature);
        }
    }
那么直接调用:
drawPoint(vectorlist);得到效果有:


代码:
    function drawLine(LineList){

        vecSource.clear();

        var lines = LineList.line;

        var line = new ol.geom.LineString();
        for(var i = 0;i < lines.length;i++){

            // var pPoint = ol.proj.transform([lines[i][0]*1,lines[i][1]*1], 'EPSG:4326', 'EPSG:3857');
            // line.appendCoordinate(pPoint);
            // var geoPoint = new ol.geom.Point([pPoint[0]*1,pPoint[1]*1]);

            line.appendCoordinate(ol.proj.fromLonLat(lines[i]));
            //标记每一个节点
            var geoPoint = new ol.geom.Point([ol.proj.fromLonLat(lines[i])[0]*1,ol.proj.fromLonLat(lines[i])[1]*1]);
            var pFeature = new ol.Feature(geoPoint);
            //pFeature.setStyle(pointStyle);
            pFeature.setStyle(new ol.style.Style({
                text:new ol.style.Text({
                    testAlign:'left',
                    text:i+"    ",
                    font:'bold 20px 微软雅黑',
                    fill:new ol.style.Fill({
                        color:'red'
                    })
                }),
            }));
            vecSource.addFeature(pFeature);
        }

        var feature = new ol.Feature(line);

        feature.setStyle(lineStyle);
        vecSource.addFeature(feature);
    }
效果:

代码:
	function drawPolygon(PloygonList){
        vecSource.clear();
		var ploys = PloygonList.polygon;
		for(var i=0;i < ploys.length;i++){
			var ploy = ploys[i];
			var json = JSON.parse(ploy);
			var polygon = new ol.geom.Polygon([json]);
			polygon.applyTransform(ol.proj.getTransform('EPSG:4326', 'EPSG:3857'));
			var feature = new ol.Feature(polygon);
			var polygonStyle = new ol.style.Style({
				text:new ol.style.Text({
                	testAlign:'center',
                	text:"区域"+i,
               		font:'bold 20px 微软雅黑',
                	fill:new ol.style.Fill({
                    	color:'black'
		  			})
		    	}),
		    	fill: new ol.style.Fill({
            		color: '#0055ff'
       			}),
				stroke: new ol.style.Stroke({
					color: '#ffcc33',
					width: 3
				})
			});
			feature.setStyle(polygonStyle);
			vecSource.addFeature(feature);
		}

    }
效果:

5、结束
由于个人喜好因素,矢量数据表现形式可能存在无数样式。所以往往大家有喜欢定制化的。那么在细节之处传入喜好的参数,就能够得到自己想要的样式了。所以有时候则需要将函数改动的更为灵活,这里静态显示其实也体现不出这种形式的好处,如若改为交互式的情形,那么所有配置参数将都可让用户自己设置。
这里仅用点显示函数做例子,其他的都类似:
function drawPoint(PointList,c1,c2,r,w){

        vecSource.clear();

        var points = PointList.point;//使用过程中需要修改为被请求服务中的字段

        for(var i=0;i<points.length;i++){

            var point = new ol.geom.Point(ol.proj.fromLonLat(points[i]));
	    	var feature = new ol.Feature(point);
	    	var pointStyle = new ol.style.Style({
	    		text:new ol.style.Text({
					testAlign:'left',
					text:i+"     ",
					font:'bold 15px 微软雅黑',
					fill:new ol.style.Fill({
						color:'yellow'
					})
				}),
    			image:new ol.style.Circle({
					radius:r,//半径
					fill:new ol.style.Fill({
						color:c1
					}),	//填充颜色
					stroke: new ol.style.Stroke({
						color: c2,
						width: w
					})//渐变颜色和大小
				})
    		});
	    	feature.setStyle(pointStyle);
	    	vecSource.addFeature(feature);
        }
    }
这里就可以将,点要素的半径、填充颜色、渐变色和大小都定制化选择了。
我得到了一个包含嵌套链接的表单。编辑时链接字段为空的问题。这是我的表格:Editingkategori{:action=>'update',:id=>@konkurrancer.id})do|f|%>'Trackingurl',:style=>'width:500;'%>'Editkonkurrence'%>|我的konkurrencer模型:has_one:link我的链接模型:classLink我的konkurrancer编辑操作:defedit@konkurrancer=Konkurrancer.find(params[:id])@konkurrancer.link_attrib
我主要使用Ruby来执行此操作,但到目前为止我的攻击计划如下:使用gemsrdf、rdf-rdfa和rdf-microdata或mida来解析给定任何URI的数据。我认为最好映射到像schema.org这样的统一模式,例如使用这个yaml文件,它试图描述数据词汇表和opengraph到schema.org之间的转换:#SchemaXtoschema.orgconversion#data-vocabularyDV:name:namestreet-address:streetAddressregion:addressRegionlocality:addressLocalityphoto:i
所以我在关注Railscast,我注意到在html.erb文件中,ruby代码有一个微弱的背景高亮效果,以区别于其他代码HTML文档。我知道Ryan使用TextMate。我正在使用SublimeText3。我怎样才能达到同样的效果?谢谢! 最佳答案 为SublimeText安装ERB包。假设您安装了SublimeText包管理器*,只需点击cmd+shift+P即可获得命令菜单,然后键入installpackage并选择PackageControl:InstallPackage获取包管理器菜单。在该菜单中,键入ERB并在看到包时选择
我试图在索引页中创建一个超链接,但它没有显示,也没有给出任何错误。这是我的index.html.erb代码。ListingarticlesTitleTextssss我检查了我的路线,我认为它们也没有问题。PrefixVerbURIPatternController#Actionwelcome_indexGET/welcome/index(.:format)welcome#indexarticlesGET/articles(.:format)articles#indexPOST/articles(.:format)articles#createnew_articleGET/article
我有一个用户工厂。我希望默认情况下确认用户。但是鉴于unconfirmed特征,我不希望它们被确认。虽然我有一个基于实现细节而不是抽象的工作实现,但我想知道如何正确地做到这一点。factory:userdoafter(:create)do|user,evaluator|#unwantedimplementationdetailshereunlessFactoryGirl.factories[:user].defined_traits.map(&:name).include?(:unconfirmed)user.confirm!endendtrait:unconfirmeddoenden
我是rails的新手,想在form字段上应用验证。myviewsnew.html.erb.....模拟.rbclassSimulation{:in=>1..25,:message=>'Therowmustbebetween1and25'}end模拟Controller.rbclassSimulationsController我想检查模型类中row字段的整数范围,如果不在范围内则返回错误信息。我可以检查上面代码的范围,但无法返回错误消息提前致谢 最佳答案 关键是您使用的是模型表单,一种显示ActiveRecord模型实例属性的表单。c
目前,Itembelongs_toCompany和has_manyItemVariants。我正在尝试使用嵌套的fields_for通过Item表单添加ItemVariant字段,但是使用:item_variants不显示该表单。只有当我使用单数时才会显示。我检查了我的关联,它们似乎是正确的,这可能与嵌套在公司下的项目有关,还是我遗漏了其他东西?提前致谢。注意:下面的代码片段中省略了不相关的代码。编辑:不知道这是否相关,但我正在使用CanCan进行身份验证。routes.rbresources:companiesdoresources:itemsenditem.rbclassItemi
导读:随着叮咚买菜业务的发展,不同的业务场景对数据分析提出了不同的需求,他们希望引入一款实时OLAP数据库,构建一个灵活的多维实时查询和分析的平台,统一数据的接入和查询方案,解决各业务线对数据高效实时查询和精细化运营的需求。经过调研选型,最终引入ApacheDoris作为最终的OLAP分析引擎,Doris作为核心的OLAP引擎支持复杂地分析操作、提供多维的数据视图,在叮咚买菜数十个业务场景中广泛应用。作者|叮咚买菜资深数据工程师韩青叮咚买菜创立于2017年5月,是一家专注美好食物的创业公司。叮咚买菜专注吃的事业,为满足更多人“想吃什么”而努力,通过美好食材的供应、美好滋味的开发以及美食品牌的孵
华为OD机试题本篇题目:明明的随机数题目输入描述输出描述:示例1输入输出说明代码编写思路最近更新的博客华为od2023|什么是华为od,od薪资待遇,od机试题清单华为OD机试真题大全,用Python解华为机试题|机试宝典【华为OD机试】全流程解析+经验分享,题型分享,防作弊指南华为o
C#实现简易绘图工具一.引言实验目的:通过制作窗体应用程序(C#画图软件),熟悉基本的窗体设计过程以及控件设计,事件处理等,熟悉使用C#的winform窗体进行绘图的基本步骤,对于面向对象编程有更加深刻的体会.Tutorial任务设计一个具有基本功能的画图软件**·包括简单的新建文件,保存,重新绘图等功能**·实现一些基本图形的绘制,包括铅笔和基本形状等,学习橡皮工具的创建**·设计一个合理舒适的UI界面**注明:你可能需要先了解一些关于winform窗体应用程序绘图的基本知识,以及关于GDI+类和结构的知识二.实验环境Windows系统下的visualstudio2017C#窗体应用程序三.