更新一下之前写的echarts简单图表公共组件的封装,该组件可以实现自适应展示效果
废话不多说,上代码:
vue-echarts通用组件
<template>
  <div class="companyList-ctn" :style="{ 'width':'100%','height': '100%' }">
    <div :id="id" :style="{'width':'100%','height': '100%'}"></div>
  </div>
</template>
<script>
let _c = { id: 1 };
import * as echarts from 'echarts';
import echartMixins from "@/utils/resizeMixins";
//引入echart
import 'echarts-gl'
export default {
  mixins: [echartMixins],
  created() {
    _c.id++;
    this.id = "charts_" + _c.id;
  },
  props: {
    echartsData: {
      type: Object,
    },
  },
  data() {
    return {
      myPieChart:'',
      width:'100%',
      height:400+'px'
    };
  },
  computed: {
    heightFun(){
      return this.echartsData.height+'px'
    }
  },
  watch: {
    echartsData:{
         handler(newval, oldVal){
           this.initChart();
         },
         deep:true //true 深度监听
     }
  },
  mounted() {
    // 初始化echarts
    this.$nextTick(()=>{
      this.initChart();
    })
    window.addEventListener('resize',this.initChart,false);
  },
  //vue组件实例销毁之前移除监听事件,避免当我们切换路由时导致vue出现警告:
  //echarts.js?1be7:2160 Uncaught Error: Initialize failed: invalid dom.
  beforeDestroy () {
    window.removeEventListener('resize', this.initChart)
  },
  methods: {
    initChart() {
      var chartDom = document.getElementById(this.id);
      if (this.myPieChart != null && this.myPieChart != "" && this.myPieChart != undefined) {
        this.myPieChart.dispose();//销毁
      }
      this.myPieChart = echarts.init(chartDom);
      this.myPieChart.resize()
      var option=this.echartsData.option
      this.myPieChart.setOption(option);
    },
  },
};
</script>
<style lang="scss" scoped>
.companyList-ctn {
  width: 260px;
  border-radius: 4px;
  // background: white;
  .companyList-oneItem {
    display: flex;
    justify-content: space-between;
    align-items: center;
  }
}
</style>
下面的一个混入文件是用来实现,窗口改变echarts自适应的js文件:
// 混入代码 resize-mixins.js
import { debounce } from '@/utils/index';
const resizeChartMethod = '$__resizeChartMethod';

export default {
  data() {
    // 在组件内部将图表init的引用映射到chart属性上
    return {
      chart: null,
    };
  },
  created() {
    window.addEventListener('resize', this[resizeChartMethod], false);
  },
  beforeDestroy() {
    window.removeEventListener('reisze', this[resizeChartMethod]);
  },
  methods: {
    // 通过lodash的防抖函数来控制resize的频率
    [resizeChartMethod]: debounce(function() {
      if (this.chart) {
        this.chart.resize();
      }
    }, 100),
  },
};
接下来是debounce.js
export function debounce(func, wait, immediate) {
  let timeout, args, context, timestamp, result;

  const later = function() {
    // 据上一次触发时间间隔
    const last = +new Date() - timestamp;

    // 上次被包装函数被调用时间间隔 last 小于设定时间间隔 wait
    if (last < wait && last > 0) {
      timeout = setTimeout(later, wait - last);
    } else {
      timeout = null;
      // 如果设定为immediate===true,因为开始边界已经调用过了此处无需调用
      if (!immediate) {
        result = func.apply(context, args);
        if (!timeout) context = args = null;
      }
    }
  };
下面直接上代码:父组件调用+展示效果
<template>
<div class="user_protocal_box">
<!-- 折线图 -->
<DayLinkRatioCharts :echartsData="dayLinkRatio" />
</div>
</template>
<script>
import DayLinkRatioCharts from "@/components/charts";
export default {
components: {
DayLinkRatioCharts
},
data () {
return {
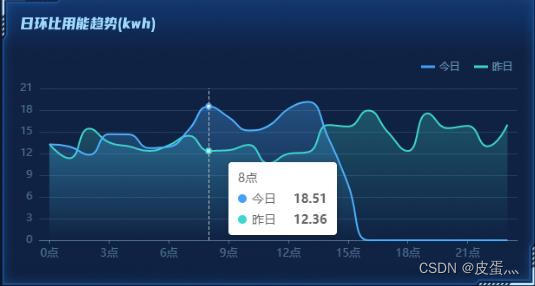
dayLinkRatio:{//日环比
option:{
tooltip: {
trigger: "axis",
},
legend: {
//标记属性
data: ['今日','昨日'],
orient: "horizontal", //标记排列显示
top:20, //标记位置
right:23, //标记位置
icon:'rect',
itemWidth: 16,
itemHeight:3,
itemGap:16,
formatter: [//用富文本组件实现图例与文字对齐的关键是富文本的格式转换
'{a|{name}}'
].join('\n'),
textStyle: {
color:'rgba(159,216,253,0.6)',
fontSize:13,
height:20,//图例字体高度
lineHeight:22, //图例字体行高
rich:{//用富文本组件实现图例与文字对齐
a:{
verticalAlign: 'middle'//图例与文字对齐方式
}
}
},
},
grid:{
//绘图区调整
left:23,
right:23,
bottom:20,
containLabel: true,
},
xAxis: {
type: "category",
boundaryGap: true,
data: ["0点","1点","2点","3点","4点","5点","6点","7点","8点","9点","10点","11点","12点","13点","14点","15点","16点","17点","18点","19点","20点","21点","22点","23点"],//x轴数据
axisLabel: {
//坐标轴文字显示样式
lineHeight: 15, //字体行高
fontSize:13,
fontNum: 15, //每行显示字数
rotate: 0, //文字旋转角度,0不旋转
color:'rgba(159,216,253,0.4)',
interval: 2//刻度间隔个数
},
axisLine: {//坐标轴线样式
lineStyle: {
color: 'rgba(159,216,253,0.4)',
type: 'solid'
},
},
axisTick:{//x轴刻度设置
alignWithLabel: true,//刻度线与点对齐
length:4,//刻度线的长度
interval: 2,//刻度间隔个数
show:true // 不显示坐标轴刻度线
},
},
yAxis:{
name:'',
type: "value",
axisLabel:{
color:'rgba(159,216,253,0.4)'
},
splitLine: {
show: true,//是否显示网格线
lineStyle: {
color: "rgba(159,216,253,0.15)",
textShadow: '0px 2px 4px 0px rgba(0,0,0,0.50)',
type: "solid"
}
},
axisLine:{show:false},//隐藏y轴
},
series: [
{
name: "今日",
data: [13.3, 11.34, 15.44, 13.53, 12.98, 12.36, 13.14, 14.46, 12.36, 12.45, 13.19, 10.64, 11.95, 12.2, 15.94, 15.73, 17.95, 14.94, 12.34, 17.55, 15.5, 15.82, 12.99, 15.98],
type: "line",
color:'#46A0FA',
showSymbol: false,//不显示圆点,hover时显示
smooth:true,//折线变为曲线
// yAxisIndex:1,
areaStyle: {//曲线阴影
opacity: 0.8,
color: new echarts.graphic.LinearGradient(0, 0, 0, 1, [
{
offset: 0,
color: "rgba(70,160,250,0.4)", // 0% 处的颜色
},
{
offset: 1,
color: "rgba(70,160,250,0)", // 100% 处的颜色
}
])
},
},
{
name: "昨日",
data: [13.25, 12.96, 11.82, 14.66, 14.63, 12.75, 12.93, 15.29, 18.51, 17.03, 15.18, 15.81, 18.18, 19.14, 14.2, 7.71, 10, 15, 5.5, 6.5, 7.5, 8.5, 9.5, 10.5,]
type: "line",
color:'#3FD4CF',
smooth:true,//折线变为曲线
showSymbol: false,//不显示圆点,hover时显示
// yAxisIndex:0,
areaStyle: {//曲线阴影
color: new echarts.graphic.LinearGradient(0, 0, 0, 1,[
{
offset: 0,
color: "rgba(63,212,207,0.4)", // 0% 处的颜色
},
{
offset: 1,
color: "rgba(63,212,207,0)", // 100% 处的颜色
}]),
},
}
],
},
},
}
},
mounted () {
},
methods: {
}
}
</script>
<style lang="scss" scoped>
</style>截图:
下面是一个仪表盘的效果:请看代码:
<template>
<div class="user_protocal_box">
<!-- 仪表盘 -->
<HeightElectricCharts :echartsData="heightElectric" />
</div>
</template>
<script>
import HeightElectricCharts from "@/components/charts";
export default {
components: {
HeightElectricCharts
},
data () {
return {
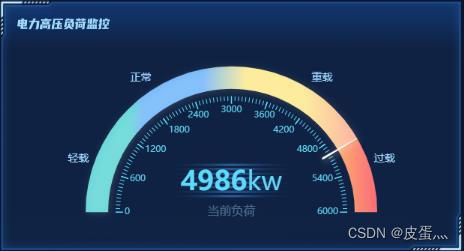
heightElectric:{//电力高压负荷监控仪表盘
option:{
series: [
{//外圈的仪表盘
type: 'gauge',
startAngle: 180,
endAngle: 0,
min: 0,
max: 6000,
radius:'140%',
center:['50%','85%'],
splitNumber: 10,
progress: {
show: true,
roundCap: false,
width:30,
itemStyle: {
color:'rgba(255,255,255,0.25)',
shadowColor: 'rgba(255,255,255,0.5)',//rgba(0,255,255,0.8)
shadowBlur: 10,
shadowOffsetX: 2,
shadowOffsetY: 2,
},
},
pointer: {//指针
icon: 'path://M2090.36389,615.30999 L2090.36389,615.30999 C2091.48372,615.30999 2092.40383,616.194028 2092.44859,617.312956 L2096.90698,728.755929 C2097.05155,732.369577 2094.2393,735.416212 2090.62566,735.56078 C2090.53845,735.564269 2090.45117,735.566014 2090.36389,735.566014 L2090.36389,735.566014 C2086.74736,735.566014 2083.81557,732.63423 2083.81557,729.017692 C2083.81557,728.930412 2083.81732,728.84314 2083.82081,728.755929 L2088.2792,617.312956 C2088.32396,616.194028 2089.24407,615.30999 2090.36389,615.30999 Z',
length: '28%',
width: 3,
offsetCenter: [0, '-72%'],
itemStyle: {
color:'rgba(255,255,255,1)',
shadowColor: 'rgba(255,255,255,0.5)',//rgba(0,255,255,0.8)
shadowBlur: 10,
shadowOffsetX: 2,
shadowOffsetY: 2,
},
},
axisLine: {//槽内颜色
roundCap: false,
lineStyle: {
width: 30,
color: [
[1,new echarts.graphic.LinearGradient(0, 0, 1, 0, [
{
offset: 0,
color: "#30C9C9"
},
{
offset: 0.15,
color: "#30C9C9"
},
{
offset: 0.2,
color: "#46A0FA"
},
{
offset: 0.4,
color: "#46A0FA"
},
{
offset: 0.55,
color: "#FCE26C"
},
{
offset: 0.75,
color: "#FCE26C"
},
{
offset: 1,
color: "#FB6C78"
}
])
]
]
}
},
axisTick: {//小刻度个数
splitNumber: 10,//小刻度个数
lineStyle: {
width:1,
color:'#5DD9FB'
}
},
splitLine: {//大刻度线
length: 10,
lineStyle: {
width:1.5,
color:'#5DD9FB'
}
},
axisLabel: {//刻度值
show:true,
distance: -55,
color: '#9FD8FD',
fontSize: 14,
offsetCenter: [-10, '0%'],
// formatter: function (value) {
// callback(value)
// },
},
title: {
show: true,
offsetCenter: [0, '0%'],
fontSize: 16,
color:'rgba(159,216,253,0.4)'
},
detail: {
width: '60%',
lineHeight: 40,
height: 40,
borderRadius: 8,
offsetCenter: [0, '-20%'],
valueAnimation: true,
formatter: function (value) {
return '{value|' + value.toFixed(0) + '}{unit|kw}';
},
rich: {
value: {
fontSize: 36,
fontWeight: 'bolder',
color: '#5DD9FB'
},
unit: {
fontSize: 35,
color: '#5DD9FB',
padding: [0, 0, 0, 0]
},
name: {
fontSize: 35,
color: '#5DD9FB',
padding: [0, 0, 0, 0]
},
}
},
data: [
{
value: 4900,
name: '当前负荷'
}
]
},
{//内圈的仪表盘刻度
type: 'gauge',
startAngle: 180,
endAngle: 0,
radius:'140%',
center:['50%','85%'],
min: 0,
max: 6000,
progress: {
show: false,
width: 30
},
axisLine: {
show: false,
lineStyle: {
width: 30
}
},
pointer:{
show:false
},
axisTick: {
show: false
},
splitLine: {
show: false,
length: 10,
lineStyle: {
width: 2,
color: '#999'
}
},
axisLabel: {
show: true,
distance:32,
color: '#5DD9FB',
fontSize: 12,
},
anchor: {
show: false,
showAbove: true,
size: 10,
itemStyle: {
borderWidth: 5
}
},
title: {
show: false
},
detail: {
show: false,
valueAnimation: true,
fontSize: 80,
offsetCenter: [0, '50%']
},
data: [
{
value: 4900
}
]
}
]
}
}
}
},
mounted () {
//仪表盘刻度值显示--该方法要放在接口返回去计算并渲染,因为刻度值转换为文字显示的是一个范围
this.heightElectric.option.series[0].axisLabel.formatter=function(value){
let oneItem=this.heightElectric.option.series[0].max/10
if (value == oneItem) {
return '轻载';
} else if (value == oneItem*3) {
return '正常';
} else if (value == oneItem*7) {
return '重载';
} else if (value == oneItem*9) {
return '过载';
}
return '';
}
},
methods: {
}
}
</script>
<style lang="scss" scoped>
</style>看图:
下面是3d柱状图:
请看图:
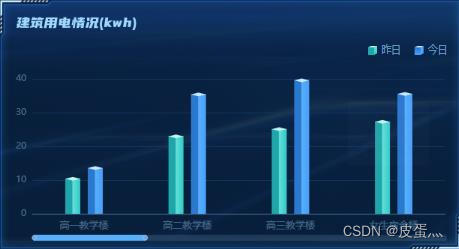
补充一下:我没有显示底部切片,是因为如果数值为0时,底部切片和顶部切片会显示,效果不是很好,所以我选择了不显示底部切片,如果小伙伴有更好的解决办法,欢迎留言,共同进步o
<template>
  <div class="user_protocal_box">
    <!-- 3d柱状图 -->
    <BuildEletricCharts :echartsData="buildEletric" />
  </div>
</template>

<script>
import BuildEletricCharts from "@/components/charts";
let barWidth = 20;
var lastColor = {//3d柱状图柱子两个侧面的颜色
  type: "linear",
  x: 0,
  x2: 1,
  y: 0,
  y2: 0,
  colorStops: [
    {
      offset: 0,
      color: '#1FA6AA',
    },
    {
      offset: 0.45,
      color: '#1FA6AA',
    },
    {
      offset: 0.5,
      color: '#66DFD7',
    },
    {
      offset: 1,
      color: '#30C9C9',
    },
  ],
};
var curColor = {//3d柱状图柱子两个侧面的颜色
  type: "linear",
  x: 0,
  x2: 1,
  y: 0,
  y2: 0,
  colorStops: [
    {
      offset: 0,
      color: '#2B78CF',
    },
    {
      offset: 0.45,
      color: '#2B78CF',
    },
    {
      offset: 0.5,
      color: '#58AFFB',
    },
    {
      offset: 1,
      color: '#46A0FA',
    },
  ],
};
export default {
components: {
    BuildEletricCharts
  },
  data () {
    return {
      buildEletric: {//建筑用电情况(kwh)
        option: {
          tooltip: {
            trigger: "axis",
            axisPointer: {
              type: "shadow", //鼠标悬停显示样式
              shadowStyle: {
                shadowColor: "rgba(0, 0, 0, 0.5)",
                shadowBlur:2,
              },
            },
            formatter: function(params) {
              var str = params[0].name + ":";
              params.filter(function(item) {
                if (item.componentSubType == "bar") {
                  if(item.seriesName=='昨天'){
                    str += "<div id='id_flex3'>"+
                      "<p id='yesterday_circle1'></p>"+
                      "<p id='id_flex'>"+item.seriesName+ "\u00a0\u00a0" +"<span id='fb'>"+item.value+"</span>"+"</p>"+
                    "</div>"
                  }else{
                    str += "<div id='id_flex4'><p id='yesterday_circle2'></p><p id='id_flex2'>" + item.seriesName + "\u00a0\u00a0" + "<span id='fb'>"+item.value+"</span>"+"</p></div>"
                  }
                }
              });
              return str;
            },
          },
          grid: {
            left:23,
            right:23,
            bottom:12,
            containLabel: true,
          },
          legend: {
            show: false,
            data: ["昨天", "今天"],
            top:20, //标记位置
            right:23, //标记位置
            icon:'rect',
            textStyle: {
              color: "rgba(159,216,253,0.4)",
              fontSize: "13",
            },
          },
          dataZoom:[{//展示不下时显示水平滚动条
              show: true,
              backgroundColor: "rgba(159,216,253,0.15)",
              borderRadius: 5,
              borderColor:"none",
              height: 8,
              startValue: 0, // 从头开始。
              endValue: 3, // 一次性展示n个。
              moveHandleIcon: "none",
              moveHandleSize: 10,
              zoomLock: true,
              brushSelect: false,
              showDataShadow: false,
              fillerColor: "#58AFFB",
              handleIcon: "path://M512,512m-448,0a448,448,0,1,0,896,0a448,448,0,1,0,-896,0Z",//滚动条圆角--官方推荐
              handleSize: "70%",
              handleColor:"#58AFFB",
              textStyle: {
                color: "transparent",
              },
              bottom: 2,
            }
          ],
          xAxis: {
            data: ['高一教学楼', '高二教学楼', '高三教学楼', '女生宿舍楼', '男生宿舍楼', '行政楼', '食堂', '音乐厅', '国际交流中心', '实验楼', '图书馆', '体育馆'],
            boundaryGap: true,
            //坐标轴
            axisLine: {
              show: true,
              lineStyle: {
                width: 1,
                color: "rgba(159,216,253,0.4)"
              },
              textStyle: {
                color: "#000",
                fontSize:20,
              },
            },
            type: "category",
            axisLabel: {
              //坐标轴文字显示样式
              lineHeight: 18, //字体行高
              fontNum: 15, //每行显示字数
              rotate: 0, //文字旋转角度,0不旋转
              textStyle: {
                color: "rgba(159,216,253,0.4)",
                fontWeight: 'normal',
                fontSize: "13",
              },
            },
            axisTick: {
              textStyle: {
                color: "#fff",
                fontSize: "16",
              },
              show: false,
            },
            splitLine: { show: false },
          },
          yAxis: {
            type: "value",
            //坐标轴
            axisLine: {
              show: false,
              lineStyle: {
                width: 1,
                color: "#214776",
              },
              textStyle: {
                color: "#fff",
                fontSize: "10",
              },
            },
            axisTick: {
              show: false,
            },
            //坐标值标注
            axisLabel: {
              show: true,
              textStyle: {
                color: "rgba(159,216,253,0.4)",
              },
            },
            //分格线
            splitLine: {
              lineStyle: {
                color: "#13365f",
              },
            },
          },
          series: [
            {
              z: 1,
              name: "昨天",
              type: "bar",
              barWidth: barWidth,
              barGap: "0%",
              data: [10.43, 23, 25.14, 27.32, 59.9, 35.82, 29.19, 19.32, 0, 2.22, 0.39, 4.1],
              itemStyle: {
                normal: {
                  color: lastColor,
                },
              },
            },
            {
              z: 2,
              name: "昨天",
              type: "pictorialBar",
              data: [10.43, 23, 25.14, 27.32, 59.9, 35.82, 29.19, 19.32, 0, 2.22, 0.39, 4.1],
              symbol: "diamond",
              symbolPosition: "start",
              symbolOffset: ["-75%", "0%"],//底部切片位置,[x,y]
              symbolSize: [0, 0],//底部切片尺寸,设置为0则不显示[宽,高]
              itemStyle: {
                normal: {
                  color: lastColor,
                },
              },
              tooltip: {
                show: false,
              },
            },
            {
              z: 3,
              name: "昨天",
              type: "pictorialBar",
              symbolPosition: "end",
              data: [10.43, 23, 25.14, 27.32, 59.9, 35.82, 29.19, 19.32, 0, 2.22, 0.39, 4.1],
              symbol: "diamond",
              symbolOffset: ["-75%", "-20%"],//底部切片位置,[x,y]
              symbolSize: [barWidth , 5],//底部切片尺寸,设置为0则不显示[宽,高]
              itemStyle: {
                normal: {
                  borderWidth: -5,
                  color: '#BEF4ED',
                },
              },
              tooltip: {
                show: false,
              },
            },
            {
              z: 1,
              name: "今天",
              type: "bar",
              barWidth: barWidth,
              barGap: "50%",
              data: [13.6, 35.43, 39.61, 35.58, 57.8, 56.58, 45.73, 39.77, 0, 2.89, 1.16, 5.93],
              itemStyle: {
                normal: {
                  color: curColor,
                },
              },
            },
            {
              z: 2,
              name: "今天",
              type: "pictorialBar",
              data: [13.6, 35.43, 39.61, 35.58, 57.8, 56.58, 45.73, 39.77, 0, 2.89, 1.16, 5.93],
              symbol: "diamond",
              symbolPosition: "start",
              symbolOffset: ["75%", "0%"],
              symbolSize: [0, 0],
              itemStyle: {
                normal: {
                  color: curColor,
                },
              },
              tooltip: {
                show: false,
              },
            },
            {
              z: 3,
              name: "今天",
              type: "pictorialBar",
              symbolPosition: "end",
              data: [13.6, 35.43, 39.61, 35.58, 57.8, 56.58, 45.73, 39.77, 0, 2.89, 1.16, 5.93],
              symbol: "diamond",
              symbolOffset: ["75%", "-20%"],
              symbolSize: [barWidth , 5],
              itemStyle: {
                normal: {
                  borderWidth: -5,
                  color: '#C4E8FE',
                },
              },
            },
          ],
        },
      },
    }
  },
  mounted () {

  },
  methods: {

  }
}
</script>

<style lang="scss" scoped>

</style>为什么series里面每一类会有重复的数据,因为我们要实现的是3d柱状图,简单理解一下,就是:我们把3d柱状图一分为三份,第一份就是底部的切片,第二份就是中间的柱子,第三份就是顶部的切片,这样就是三份数据
今天的分享就到这里把,如果小伙伴有更好的解决办法,欢迎留言,共同进步o
无论您是想搭建桌面端、WEB端或者移动端APP应用,HOOPSPlatform组件都可以为您提供弹性的3D集成架构,同时,由工业领域3D技术专家组成的HOOPS技术团队也能为您提供技术支持服务。如果您的客户期望有一种在多个平台(桌面/WEB/APP,而且某些客户端是“瘦”客户端)快速、方便地将数据接入到3D应用系统的解决方案,并且当访问数据时,在各个平台上的性能和用户体验保持一致,HOOPSPlatform将帮助您完成。利用HOOPSPlatform,您可以开发在任何环境下的3D基础应用架构。HOOPSPlatform可以帮您打造3D创新型产品,HOOPSSDK包含的技术有:快速且准确的CAD
本教程将在Unity3D中混合Optitrack与数据手套的数据流,在人体运动的基础上,添加双手手指部分的运动。双手手背的角度仍由Optitrack提供,数据手套提供双手手指的角度。 01 客户端软件分别安装MotiveBody与MotionVenus并校准人体与数据手套。MotiveBodyMotionVenus数据手套使用、校准流程参照:https://gitee.com/foheart_1/foheart-h1-data-summary.git02 数据转发打开MotiveBody软件的Streaming,开始向Unity3D广播数据;MotionVenus中设置->选项选择Unit
Unity自动旋转动画1.开门需要门把手先动,门再动2.关门需要门先动,门把手再动3.中途播放过程中不可以再次进行操作觉得太复杂?查看我的文章开关门简易进阶版效果:如果这个门可以直接打开的话,就不需要放置"门把手"如果门把手还有钥匙需要旋转,那就可以把钥匙放在门把手的"门把手",理论上是可以无限套娃的可调整参数有:角度,反向,轴向,速度运行时点击Test进行测试自己写的代码比较垃圾,命名与结构比较拉,高手轻点喷,新手有类似的需求可以拿去做参考上代码usingSystem.Collections;usingSystem.Collections.Generic;usingUnityEngine;u
之前说过10之后的版本没有3dScan了,所以还是9.8的版本或者之前更早的版本。 3d物体扫描需要先下载扫描的APK进行扫面。首先要在手机上装一个扫描程序,扫描现实中的三维物体,然后上传高通官网,在下载成UnityPackage类型让Unity能够使用这个扫描程序可以从高通官网上进行下载,是一个安卓程序。点到Tools往下滑,找到VuforiaObjectScanner下载后解压数据线连接手机,将apk文件拷入手机安装然后刚才解压文件中的Media文件夹打开,两个PDF图打印第一张A4-ObjectScanningTarget.pdf,主要是用来辅助扫描的。好了,接下来就是扫描三维物体。将瓶
C#实现简易绘图工具一.引言实验目的:通过制作窗体应用程序(C#画图软件),熟悉基本的窗体设计过程以及控件设计,事件处理等,熟悉使用C#的winform窗体进行绘图的基本步骤,对于面向对象编程有更加深刻的体会.Tutorial任务设计一个具有基本功能的画图软件**·包括简单的新建文件,保存,重新绘图等功能**·实现一些基本图形的绘制,包括铅笔和基本形状等,学习橡皮工具的创建**·设计一个合理舒适的UI界面**注明:你可能需要先了解一些关于winform窗体应用程序绘图的基本知识,以及关于GDI+类和结构的知识二.实验环境Windows系统下的visualstudio2017C#窗体应用程序三.
关闭。这个问题不符合StackOverflowguidelines.它目前不接受答案。要求我们推荐或查找工具、库或最喜欢的场外资源的问题对于StackOverflow来说是偏离主题的,因为它们往往会吸引自以为是的答案和垃圾邮件。相反,describetheproblem以及迄今为止为解决该问题所做的工作。关闭9年前。Improvethisquestion是否有适用于这些的3d游戏引擎?
文章目录1.自动驾驶实战:基于Paddle3D的点云障碍物检测1.1环境信息1.2准备点云数据1.3安装Paddle3D1.4模型训练1.5模型评估1.6模型导出1.7模型部署效果附录show_lidar_pred_on_image.py1.自动驾驶实战:基于Paddle3D的点云障碍物检测项目地址——自动驾驶实战:基于Paddle3D的点云障碍物检测课程地址——自动驾驶感知系统揭秘1.1环境信息硬件信息CPU:2核AI加速卡:v100总显存:16GB总内存:16GB总硬盘:100GB环境配置Python:3.7.4框架信息框架版本:PaddlePaddle2.4.0(项目默认框架版本为2.3
按照目前的情况,这个问题不适合我们的问答形式。我们希望答案得到事实、引用或专业知识的支持,但这个问题可能会引发辩论、争论、投票或扩展讨论。如果您觉得这个问题可以改进并可能重新打开,visitthehelpcenter指导。关闭11年前。在哪里可以找到python的中期或长期路线图。借此,我可以了解决策者最关心的是什么,以及他们眼中这门语言的future是什么?一段时间以来,我一直在玩弄Python和Ruby,制作我在开发中需要的中小型工具,通过比较不同但相似的语言来获得乐趣和学习。Python和Ruby的许多特性可以互换,或者易于模仿。两者都引入了一些函数式风格并且发展迅速(Py300
目录一、世界坐标系与本地坐标系二、srcGameObject.transform.TransformPoint(Vector3 vec)三、srcGameObject.transform.TransformVector(Vector3 vec)四、srcGameObject.transform.TransformDirection(Vector3 vec)五:示例一、世界坐标系与本地坐标系 世界坐标很好理解,就是模型的transform.position,通常在无父物体的情况下,创建出来的模型默认位置就是世界坐标系的原点。 每个物体都有自身的坐标系,此坐标系就是本地坐标系。本地坐标
我正在寻找用于开发ruby游戏的3D引擎。我找到了一些类似G3Druby或ogreb的东西。哪个更好用,功能更好?还有比这些更好的引擎吗? 最佳答案 两者似乎都是G3D和Ogre的包装器,因此您实际上应该比较G3D或Ogre是否更适合您的需求。通过包装器的大部分ruby外访问将在设置场景时进行,因此繁重的工作(每一帧)仍然在C/C++库和图形硬件上完成。因此,您应该比较这两个库。我不知道G3D,但它似乎提供了Ogre所缺乏的离线渲染功能。如果您需要专业游戏渲染引擎的广泛功能,Ogre通常是首选,并且您会发现几乎所有您会遇到的